TL;DR: The most dangerous intersections in Los Angeles include Imperial Highway and Vista Del Mar, Hollywood Boulevard and Highland Avenue, and several Northridge crossings with high crash and injury rates. Drivers, pedestrians, and cyclists face greater risk due to heavy traffic and speeding, and fault often falls on drivers, making crash evidence critical after a collision.
Highlights:
- Drive extra cautiously on the city’s High-Injury Network streets.
- Treat left turns as high-risk and wait for protected green arrows.
- Expect pedestrians to step out early where leading intervals are used.
- Slow down near refuge islands and curb extensions that shorten crosswalks.
- Build in extra time near LAX routes, including Imperial Hwy and Vista Del Mar.
- On I-5 and I-10, keep more following distance and minimize lane changes.
- After any crash, track medical visits, missed work, and repair estimates.
Tip: If you’re in a collision, take photos, get witness contacts, and share only verified facts with insurers.
Table of Contents
The Los Angeles Car Accident Lawyers Of Arash Law Share Some Statistics To Help Keep You Safe
Los Angeles is arguably among the cities in the nation with a high number of traffic accident fatalities. After years of high accident rates and scores of traffic deaths, in 2015, Mayor Eric Garcetti announced an ambitious plan known as Vision Zero, intended to eliminate traffic fatalities in Los Angeles by 2025.
The comprehensive plan called for a 20 percent reduction in deaths by 2017. Instead, as Curbed reports, traffic fatalities increased by 43 percent during the first year of the plan (2016). The Los Angeles Times reports a slight 6 percent drop in 2017, but this was still well above the average. These high numbers may not bode well for the next phase of Vision Zero. The original plan called for a 50 percent reduction in fatalities by 2020. At this point, the City will be lucky to simply get back to the average.
Why Accident Victims In Los Angeles Should Consider Retaining A Car Accident Lawyer
After an auto accident, victims typically have to deal with paperwork and insurance claims when they should be focusing on their health. Even worse, they usually are dealing with an insurance company that is working against them. The other driver’s insurance company is responsible for evaluating your claim based on their terms and policies. Insurance adjusters are trained to evaluate claims thoroughly and may offer settlements that do not fully account for all losses.
Victims have the right to be represented by car accident lawyers who can advocate for their legal rights and help navigate car accident claims to seek compensation for all losses. Experienced Los Angeles auto accident lawyers can review the facts and evidence, handle communications with insurance companies, and provide guidance on potential legal options.
Call Arash Law at (888) 488-1391 to discuss your case. We offer free initial consultations with our experienced Los Angeles traffic accident lawyers. We have years of experience assisting auto accident victims in pursuing compensation for their losses after a crash, representing their interests and advocating for their legal rights before the at-fault parties and their insurers.
Why Does Los Angeles Have So Many Traffic Accidents?
Like many cities in the western United States, Los Angeles is a “car city.” Dense urban areas in the eastern U.S., like New York and Boston, were built vertically with many high-rise buildings. Los Angeles was built out across a wide area that covers many more miles. Cars are the easiest way to cover these long distances. Unlike New York or Boston, public transportation cannot effectively move everyone in Los Angeles to the many different places they are headed. Buses and light rail take a long time to cover lengthy commutes. There are simply more miles to drive in Los Angeles.
In addition to more miles, there are more people driving those miles. Curbed notes that, in 2014, Los Angeles County had more than double the number of pedestrian deaths as the next highest contender (Maricopa County, Arizona, home to the busy “car city” of Phoenix). However, Los Angeles County, with over ten million residents, also has more than double the population of Maricopa County (which has only 4.3 million residents). More residents also mean more miles driven. Across the world, driving more miles typically results in more traffic accidents.
These and other factors led Mayor Garcetti to champion Project Vision Zero. The goal of reducing the many fatal traffic accidents in Los Angeles is certainly an important one. All Angelenos must work together to help make our roads safer. The mayor and City Council play a crucial role in coordinating efforts to enhance city infrastructure, raise public awareness, and implement other necessary changes to make Los Angeles’ roads safer for everyone. So, why did accident rates increase significantly after the project began?
How Is Vision Zero Being Implemented In Los Angeles?
Vision Zero is a comprehensive collection of individual changes that officials are implementing around the city. The City has expressed its commitment to adopting a data-driven approach in designing Vision Zero. This means that the injury statistics dictate where change is needed. The City has identified a high-injury network of streets with a higher incidence of traffic accidents. Many individual improvements are focused on these problem areas. Here are just a few of the many changes being implemented by the City:
Protected Left Turns
Left turns are a notoriously dangerous traffic pattern. This is especially true when the left turn lane must yield to oncoming traffic. Many accidents are caused by left-turning drivers who do not see an oncoming vehicle or pedestrian in the crosswalk. These left-turn accidents can be reduced by using protected left-turn signals. That is when the left-turn lane has a green arrow, and all other traffic (including pedestrians in the crosswalk) must stop.
Speed Feedback Signs
Many Angelenos are familiar with these indicators that monitor vehicles on a particular road and display the speed of each driver. They are important tools that make drivers aware of their speed and indicate when it is time to slow down. Speed has correlated with the severity of vehicle accident injuries.
Leading Pedestrian Intervals
Right turn lanes can be regulated by a solid light or an arrow. As every driver should know, an arrow means that you have the right-of-way and can make your turn. A solid green light means that you must wait until the road is clear of others who are crossing the street to your right to make your turn. This rule typically applies to bicyclists and pedestrians; if you are in the right lane, there should be no other vehicles to your right. Many drivers are impatient to make it past pedestrians or bicyclists who are moving much more slowly than they are. By changing the crosswalk signal to prohibit right turns while others are crossing the street, pedestrians and cyclists will have a head start on crossing the intersection.
Pedestrian Refuge Islands
Adding pedestrian refuge islands is one of many infrastructure changes designed to reduce the time a pedestrian must spend in a crosswalk. By adding a safe pedestrian island in the middle of a road, pedestrians need only cross one direction of traffic at a time.
Curb Extensions
This, too, is an infrastructure change designed to reduce the time a pedestrian must spend in a crosswalk. Here, the crosswalk itself is actually shortened. Curbs are extended with concrete or other physical barriers that project into the existing roadway. Unfortunately, not all Angelenos are in favor of the changes proposed under the Vision Zero initiative.
One such problem area was Vista del Mar, a popular commuting route near Dockweiler State Beach. The City recently paid $9.5 million to settle a claim by the family of a teenage girl who was killed in a traffic accident there. Another lawsuit was in the works, and the City targeted this area for safety improvements. Lanes were eliminated in each direction. Unfortunately, this sparked a wave of heated public backlash. Frustrated commuters flooded City Hall with angry calls. A condo association sued the City. Residents raised money to recall Councilman Mike Bonin.
According to the Los Angeles Times, Bonin conceded to protesters in a YouTube video, acknowledging that “most people outright hated” the change. He promised that the lanes would be restored. The Vista del Mar debacle illustrates one of the key problems with the Vision Zero approach. If Angelenos do not support road and traffic changes, they will not happen, regardless of what the research says. Political pressure is likely to keep the City from initiating many changes that are supported by the data. If this continues, traffic deaths will continue, and the City will likely waste even more money implementing changes that must later be undone.
Other projects are generating less controversy. The Los Angeles Department of Transportation reports that it is currently working on many projects, including bicycle signage, bike lane improvements, new bike paths and connections, traffic roundabouts, greenways, school infrastructure improvements to make roads safer for young children, and other street improvements that increase mobility and designate areas for different road users.
The Five Highly Dangerous Intersections In The City Of Los Angeles
LA Weekly reports on five intersections in the greater Los Angeles metro area that have a high number of traffic accidents. These rankings are based on an analysis of 2015 crash data. Be especially careful when driving in these areas:
1. Devonshire Street And Reseda Boulevard (Northridge)

Devonshire Street and Reseda Boulevard had 24 accidents and 41 injuries in 2015. The LAPD’s Devonshire Division has a station right around the corner. This has not deterred unsafe driving, but it is good for accident victims to know that help is nearby.
2. Imperial Highway And Vista Del Mar (Playa Del Rey)

Imperial Highway and Vista Del Mar had 26 crashes and 39 injuries in 2015. It is near LAX, which means that passengers could be more likely to get delayed on the way to the airport. Allow extra time to get to the airport if your route takes you through Playa Del Rey.
3. Balboa Boulevard And Nordhoff Street (Northridge)
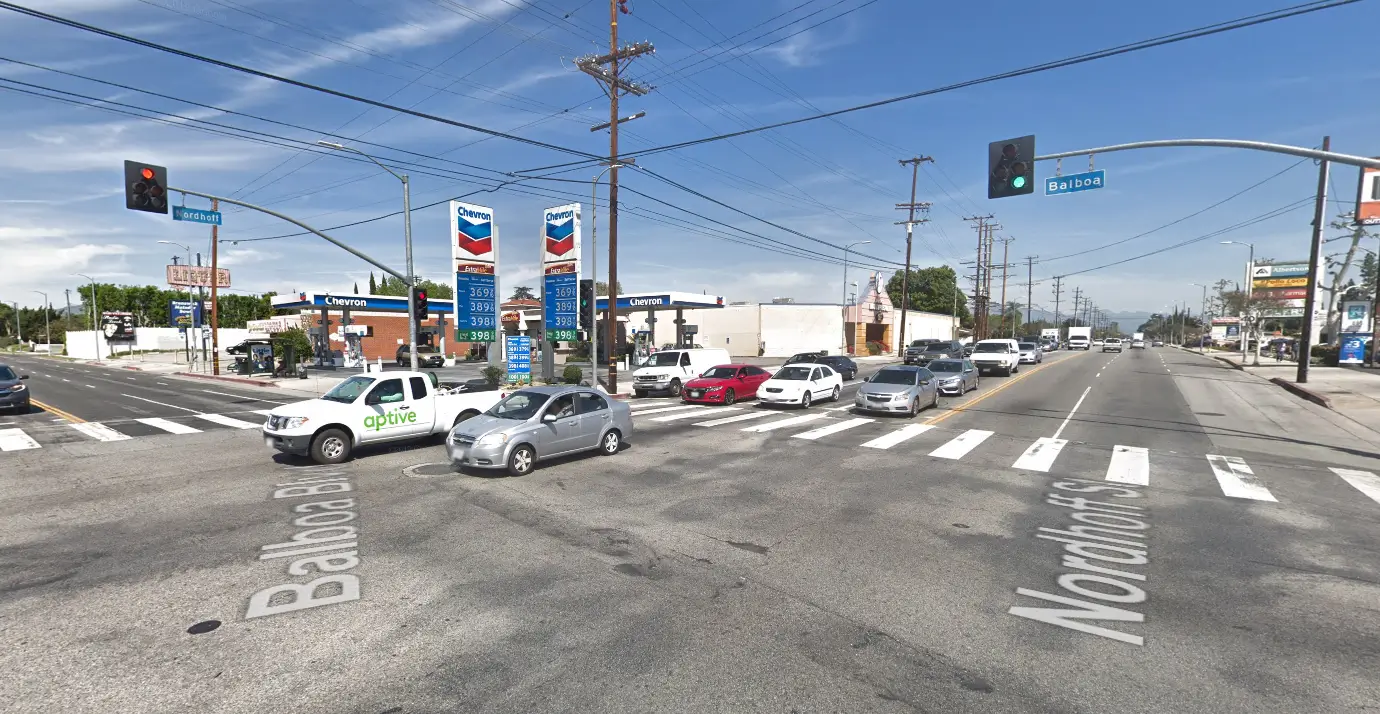
Twenty-six crashes and 37 injuries occurred at Balboa Boulevard and Nordhoff Street in 2015. A nearby shopping center adds to the confusion at this intersection, serving as a reminder that drivers must exercise extra caution in these areas. Exiting vehicles, changes in traffic patterns, and unexpected movements can result in serious auto accidents.
4. Firestone Boulevard And Lakewood Boulevard (Downey)

In 2015, 36 crashes occurred, resulting in 32 injuries. Firestone Boulevard and Lakewood Boulevard are also located near a major shopping center. It also has the added disadvantage of being located right on the corner of an In-N-Out Burger. As any Southern Californian knows, In-N-Out creates long lines of cars. These lines often extend into the traffic lane, creating other unsafe situations. Be especially careful when driving near an In-N-Out, Dutch Bros Coffee, and other restaurants that tend to create long lines of cars.
5. Lindley Avenue And Roscoe Boulevard (Northridge)
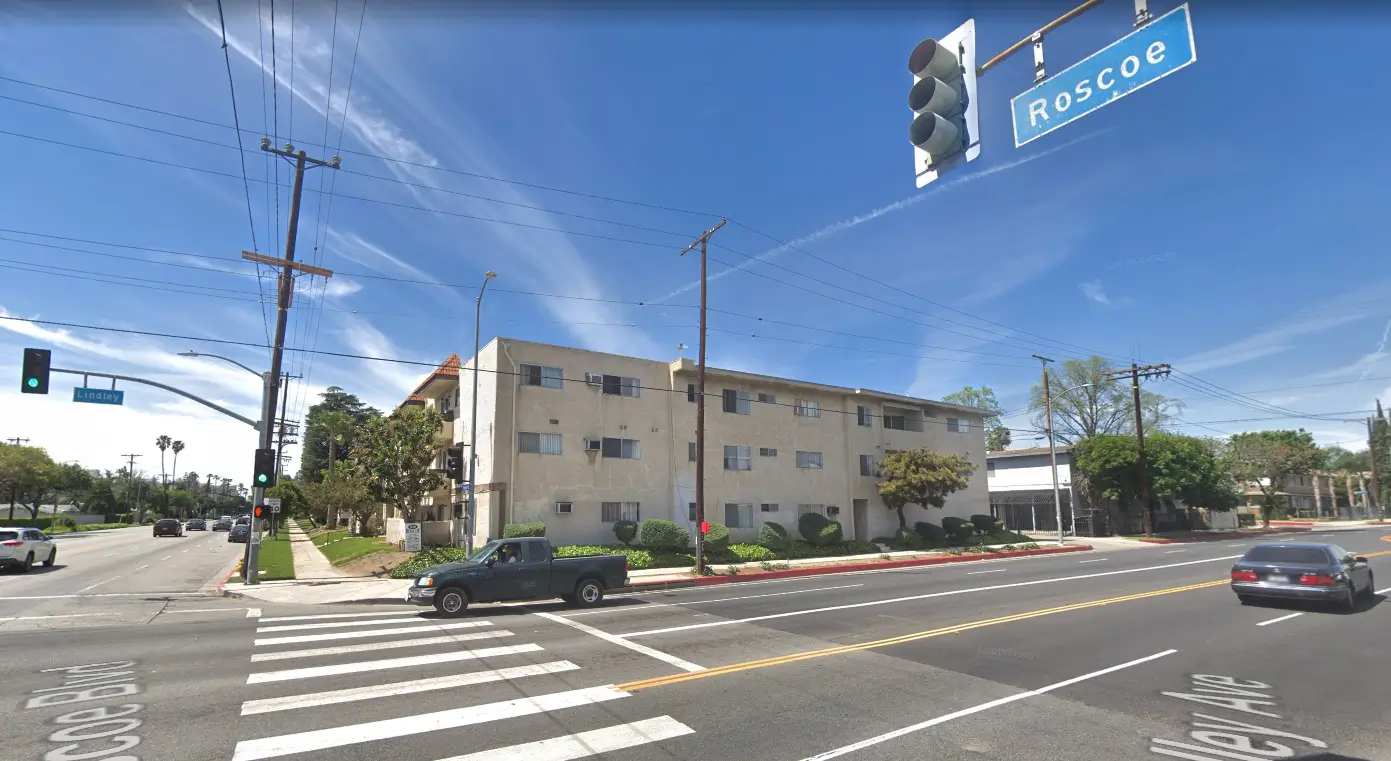
Lindley Avenue and Roscoe Boulevard had 16 crashes and 31 injuries in 2015. Interestingly, it was the only one of the five intersections to experience a fatal accident. Two deaths were reported at this intersection in 2015.
This information was obtained from an analysis of the hazardous intersections throughout California. Nearly half of these intersections (221 of 444) were located within the boundaries of the City of Los Angeles. This shows just how dangerous our roads can be.
The Most Dangerous Intersections In Los Angeles County
According to the Los Angeles Daily News, just six percent of the city streets accounted for 65 percent of deaths and serious injuries to pedestrians and bicyclists. This statistic was shared by City officials after an analysis of traffic data from 2009 to 2013. These figures indicate that certain roads and intersections are inherently more hazardous than others. All road users — including drivers, pedestrians, bicyclists, scooter riders, rideshare users, motorcyclists, and others — should be especially cautious when driving in these areas:
Downtown Los Angeles
In 2013, Curbed reported on the intersections in Los Angeles with a significant rate of injuries and deaths resulting from traffic accidents. The 2013 list includes some different intersections that didn’t appear on later lists. This means that more and more intersections are becoming increasingly dangerous every year. Drivers must continue to be cautious when driving through any intersection, but especially when passing through intersections that are on the growing list of dangerous areas:
- Alvarado Street and Seventh Street — In 2013, Alvarado Street and Seventh Street were reported to have had 25 vehicle-pedestrian accidents in the previous five years. Given the heavy traffic and many features of the area, this is not entirely surprising. In addition to two major roadways, the region also has bike lanes and parking lanes. The area also features numerous bus stops, restaurants, and businesses.
- Union Avenue and Sixth Street — This intersection had 19 vehicle/pedestrian accidents in the same period. It, too, has many bus stops and businesses in the area. Interestingly, the Rampart Station of the LAPD is also on this corner. Hopefully, this police presence will encourage drivers to be especially cautious at Union Avenue and Sixth Street.
- Spring Street and Fifth Street — Spring Street and Fifth Street also had 19 vehicle/pedestrian accidents in the same period. In addition to the buses and stores, this intersection is surrounded by many nearby cultural attractions. The Spring Street Park and the Los Angeles Theater Center flank the intersection on either side. The area also features unique businesses, including an independent record store and a cocktail bar situated in a 1920s bank vault. There are lots of interesting things to see and do in this area. However, drivers, pedestrians, bicyclists, bus drivers, scooter riders, motorcyclists, and all other road users must exercise extreme caution in this area, which is known for its high incidence of collisions.
Playa Del Rey
- Imperial Hwy and Vista Del Mar — This is the site of the City’s quick reversal after road improvements were angrily protested by residents. Despite all the politics and drama, the statistics indicate that this is a hazardous intersection. Curbed reports that Imperial Hwy and Vista Del Mar ranked as the second most dangerous intersection in Los Angeles in 2015. This was after it had been designated the most dangerous on a similar list the year before. If you travel near this area, be especially careful of the dangers associated with this intersection. Do not let yourself engage in road rage or become frustrated by construction or delays. Continue to slow down and watch carefully for pedestrians, bicyclists, and other road users.
Hollywood
- Hollywood Boulevard at Highland Avenue — At the end of 2015, Curbed named Hollywood Boulevard at Highland Avenue the dubious title of most dangerous intersection in Los Angeles. Part of the problem is the high number of tourists, which causes excessive foot traffic in the area. Within a short walk of the intersection are the Walk of Fame, Grauman’s Chinese Theater, the iconic El Capitan Theater, and the historic Roosevelt Hotel. But foot traffic in the area is not limited to tourists: the nearby Hollywood and Highland Center is one of the largest commercial spaces in Southern California. It features shops, restaurants, and the Kodak Theater, host of the Oscars. This means the world press descends on this intersection during awards season. The area is further congested by the Hollywood Bowl. Tour buses, public transit, cars, and pedestrians all descend on one small area to access the many amenities of this popular area. These conditions may create a heightened potential for collisions.
In incidents involving Lyft or other rideshare services, Hollywood Lyft accident lawyers can review the circumstances, examine available evidence, and provide guidance on potential legal options for those injured in these collisions.
South-Central Los Angeles
- Western Avenue and Slauson Avenue — Curbed recently reported on the most dangerous intersections for pedestrians in Los Angeles. Based on data from 2002 to 2013, the unfortunate title of Worst Intersection in Los Angeles was awarded to Western Avenue and Slauson Avenue. Forty-one pedestrian collisions resulted in two deaths during the study period. Two significant factors were identified as contributing to the road’s particular danger to pedestrians. First, drivers’ increased speed in this area meant that injuries were more likely to be serious. Second, the road width required pedestrians to cross five lanes of traffic. Longer crossing times can create more opportunities for pedestrians to be struck.
- Imperial Highway Between Athens Way and Vermont Avenue — In December 2018, the Los Angeles City Council approved a list of 23 corridors and 60 intersections in need of urgent safety improvements. This list was generated under Project Vision Zero to focus the City’s attention on road areas that are particularly hazardous. Curbed reports that the most dangerous street identified by Project Zero was the Imperial Highway between Athens Way and Vermont Avenue in South LA. Between 2013 and 2017, more than 21 people were killed or injured per mile of roadway. This was higher than any other intersection or corridor on the list.
Downey
- Firestone Boulevard and Lakewood Boulevard — The Downey Patriot reports on a study that found Firestone Boulevard and Lakewood Boulevard to be the fourth most dangerous in California. This study was based on an analysis of 2015 crash data, which reported 36 crashes and 32 injuries at this intersection. (No fatalities were reported that year.) Interestingly, the Downey Police Department disputed this finding. The Department issued a statement in response, noting that it is one of the few California law enforcement agencies that will take an accident report on request, even if there are no injuries. This means that many accidents that would not be reported in other jurisdictions are reported in Downey. Whether this affects the validity of the study or not, it is important to note that this intersection was still identified as one of the most dangerous in Downey. Use caution when traveling in this area.
Redondo Beach
- Vincent Street and Pacific Coast Highway — Vincent Street and Pacific Coast Highway were the site of a multiple-fatality accident on December 17, 2014. The Daily Breeze reports that a group of twelve pedestrians was leaving St. James Catholic Church after a Christmas pageant performed by students at the church’s school. A woman ran a red light and struck the group of pedestrians, killing four and injuring eight. The victims who suffered fatal injuries included two elderly women, as well as a kindergartner and his mother. According to KTLA, the other victims included children who were between five and fourteen years old. The driver, Margo Bronstein, was sentenced in June 2016. She pleaded guilty to four counts of vehicular manslaughter with gross negligence. The Daily Breeze reported that prosecutors had dropped all impaired driving charges after lab results did not find evidence that she was under the influence of drugs or alcohol at the time of the accident. Although she faced a 10-year prison sentence, the court sentenced her to three years and four months instead. Many of the victims’ families were devastated by this result. With credit for time served and good behavior, Bronstein was eligible for release within a few months of the sentencing hearing.
Victims and their families affected by such accidents may seek guidance from Redondo Beach personal injury attorneys, who can explain legal options, review the facts and evidence, and outline potential paths for seeking compensation under the law.
Northridge
- Lindley Avenue and Roscoe Boulevard — According to LA Weekly, Lindley Avenue and Roscoe Boulevard had two fatal accidents in 2015. While this might not sound very high, it was two more than any of the other top-ranking dangerous intersections had. CBS Local reports that one of these accidents took the life of a young student, just 19, at Cal State Northridge. A drunk driver struck her vehicle and caused her death on Father’s Day.
- Reseda Boulevard and Devonshire Street — In early 2018, Reseda Boulevard and Devonshire Street were deemed the most dangerous in California. CBS Los Angeles reports that two separate teams using two different sets of data came to this conclusion. Time Magazine reviewed ten years of data from the National Highway Traffic Safety Administration, while a team at the Institute of Sustainability at Cal State Northridge analyzed information from the Traffic Injury Mapping System. Between 2006 and 2016, there were 108 accidents at this intersection. Twenty-nine children under the age of fourteen were victims of injuries in these accidents. Northridge drivers must be especially cautious when driving near this area, which is known to be dangerous.
Santa Monica
Hoodline reports on the most dangerous intersections in Santa Monica:
- 1500 Block of Second Street — The 1500 block of Second Street had four reported crashes in April 2019, making it the most dangerous intersection in Santa Monica that month. That block also experienced an increase in accidents over the past year (10 this year versus eight the year before).
- 1500 Block of the Pacific Coast Highway — The 1500 block of the Pacific Coast Highway had three crashes reported in April 2019. Interestingly, it has a twelve-month total of 28 collisions, representing a significant decrease from 34 collisions in the previous year.
- Lincoln Boulevard and Michigan Avenue — The intersection of Lincoln Boulevard and Michigan Avenue had three reported collisions in April 2019. It experienced twelve collisions over the past year, up from five the year before.
- 1500 Block of 4th Street — The 1500 block of 4th Street also had three reported collisions in April 2019. It had twelve collisions over the past year, up from seven the year before.
- Lincoln Boulevard and Pico Boulevard — The intersection of Lincoln Boulevard and Pico Boulevard has seen the greatest rise in collisions over the past year, with 23 reported incidents in the past 12 months, compared to 13 the year before. There was one collision at that intersection in April 2019 and two in March 2019.
- Cloverfield Boulevard and Pico Boulevard — On a more positive note, the intersection that has seen the largest drop in traffic collisions is at Cloverfield Boulevard and Pico Boulevard, which hasn’t experienced an incident in the last three months. There have been four reported collisions at that spot in the past year, down from 18 the year before. Overall, Santa Monica saw a decline in collisions last month, from 191 in March to 170 in April, which also represents a slight drop from 174 incidents in April of last year.
If you or a loved one were involved in a crash at any of these intersections, Santa Monica car accident attorneys can provide guidance on your legal options. They can explain how the law applies to your situation, review the facts and available evidence, and outline potential paths for seeking compensation.
The Two Most Dangerous Highways In Los Angeles County
In addition to dangerous intersections, there are certain roads in Los Angeles that are known to be hazardous:
Interstate 5 In California
The I-5 is one of the major north/south routes on the Interstate Highway System. Located primarily in California, it begins at the Mexican border and extends north through Oregon and Washington to the Canadian border. San Diego, Los Angeles, Santa Ana, Stockton, Sacramento, and Redding are some of the major California cities connected by the I-5. This highway is one of the most dangerous roads in Los Angeles in terms of fatal car accidents. The Los Angeles Times reports that the 5 was the California route with the highest number of fatalities (192) between 2015 and 2017.
Interstate 10 In California
The I-10 is a major east/west route of the Interstate Highway System. Its western end starts at the Pacific Ocean in Santa Monica before crossing through Los Angeles and San Bernardino. The I-10 crosses the California desert into Arizona before continuing east to Jacksonville, Florida. Like the I-5, the I-10 also has a high number of traffic fatalities in California. According to the Los Angeles Times, it had the second-highest number of deaths of any California route (100) between 2015 and 2017.
Interstate highways have a disproportionately high number of accidents due to the increased amount of traffic that passes on them. These accidents are also more likely to be fatal, largely due to higher speeds. Other causes of interstate accidents include:
- Driving While Distracted — Since the widespread availability of smartphones and other mobile devices, distracted driving has become a major public health risk. The National Highway Traffic Safety Administration reports that more than three thousand deaths were caused in the United States in 2017 by distracted driving. The California Vehicle Code prohibits the use of handheld devices while driving (though hands-free devices and features are allowed). Distracted driving is quickly becoming a problem on par with impaired driving.
- Driving While Impaired — Like every other state in the nation, California law prohibits drivers from operating a motor vehicle while under the influence of drugs, alcohol, or any combination thereof. These strict laws have been supplemented by extensive advocacy efforts from groups such as Mothers Against Drunk Driving and Students Against Drunk Driving. Despite these sweeping changes, impaired driving continues to be a major cause of death on American highways. The Centers for Disease Control and Prevention reports that more than ten thousand people were killed by drunk drivers in the United States in 2016. This accounted for 28 percent of all traffic fatalities that year.
- Driving While Tired — On long, desolate highways, sleepiness can quickly overcome a driver who is not prepared. Interstate 5 and Interstate 10 both travel through deserted areas where a driver’s attention might wander. This boredom can cause a driver to become sleepy and increase the likelihood of an accident. Be careful when taking long drives on rural roadways. Listen to music, open the window, chew gum, or engage in other small tasks to keep your mind alert. Pull over when necessary and find a safe place to rest up before hitting the road again.
Traffic Accidents In Los Angeles By The Numbers
In early 2017, Curbed reported that 260 people died in Los Angeles traffic accidents in 2016. This equals one death every forty hours. By early 2019, Curbed was only able to report a drop to 240 traffic accident deaths in 2018. Even with this drop, there were still 57 more traffic fatalities than in 2015 when Mayor Garcetti announced Project Vision Zero. Part of the problem is a simple increase in traffic: 2016 set an all-time record for the number of miles driven on Los Angeles’ roads. With this trend, the 20 percent reduction Vision Zero called for in 2017 would only bring the City back to 2015 death levels.
Pedestrians
Across the country, pedestrian accidents account for a disproportionate number of traffic deaths. This is because pedestrians have no protection from the force of a collision. Vehicle occupants are protected by airbags, seatbelts, and the vehicle’s steel frame. Bicyclists have helmets and other protective gear. Pedestrians often sustain the full impact of a collision directly on their bodies. Curbed reports that 127 pedestrians were killed in Los Angeles traffic accidents in 2018. This is more than half the total of all auto accident fatality victims that year. It is also a significant increase from the 82 pedestrian deaths recorded in 2015. In such cases, pedestrian accident lawyers can provide guidance on the legal options available and help review the facts and evidence to determine potential avenues for compensation.
Bicyclists
Bicycle accidents resulted in 21 fatalities in Los Angeles in 2018, according to U.S. News and World Report. This, too, is an increase from 2015 (when only 17 bicycle deaths were reported). Thousands of bicyclists are injured in traffic accidents every year.
Motorcycles
Motorcycle accidents can also cause death and serious injury. While motorcycle riders often have more protection than pedestrians or bicyclists, they are also traveling at higher speeds. Speed increases the force generated by a collision. This, in turn, increases the severity of injuries that are sustained. Southern California Public Radio reports that motorcycle deaths increased by 59 percent between 2010 and 2012 in Los Angeles County. During the same period, motorcycle registrations increased by only five percent. This means that the difference is not just due to more motorcycles being driven on the streets of Los Angeles. It also means that all drivers need to do a better job of watching out for motorcycles.
Who Was At Fault?
It is also worth noting who can be held liable for Los Angeles traffic collisions. LA Weekly reported on a study that found drivers to be at fault in 41 percent of the accidents, while pedestrians were at fault in 31 percent of reported accidents. Bicyclists were at fault in less than one percent of accidents. This means that drivers must do a better job of keeping their eyes on the road. They must reduce their speed and watch out for other road users to better avoid collisions.
Injured In A Car Wreck? Discuss Your Case With A Los Angeles Car Accident Attorney
If you or a loved one has been injured in a Los Angeles car crash, you know firsthand the losses that an accident can cause. Medical bills, pain and suffering, lost wages, and property damage are just some of the losses that you might suffer after a serious accident. Our auto accident lawyers at Arash Law work to document your losses and present them to insurance companies or, if necessary, in court. We advocate for the legal rights of accident victims and help them pursue compensation. Contact Arash Law at (888) 488-1391 or complete our “Do I Have A Case?” form here to schedule your free initial consultation with a Los Angeles personal injury lawyer.