TL;DR: California car accident statistics show about 4,000 deaths and over 200,000 injuries each year, with speeding, alcohol use, and seatbelt non-use driving many fatal crashes. Drivers, pedestrians, cyclists, and motorcyclists face the highest risk, especially in urban areas, and fault often links to impaired or reckless driving that triggers insurance liability.
Highlights:
- Use UC Berkeley’s TIMS maps to identify high-crash routes near you.
- Check the OTS Collision Ranking Tool when comparing city crash risk.
- Slow down – speeding drives a large share of serious California crashes.
- Plan a sober ride on weekends, especially 4 p.m. to 3 a.m.
- Buckle up every trip, especially at night when non-use is higher.
- Take extra care at intersections and interchanges – frequent collision points.
- Watch for pedestrians, bicyclists, and motorcyclists on busy urban roads.
Tip: After any crash, photograph the scene and vehicles, save medical and repair records, and when speaking with insurance, stick to observable facts and avoid guessing.
Table of Contents
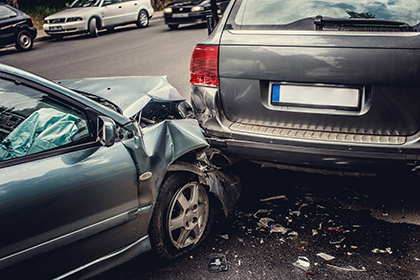
California, the most populous state in the United States, is known for its breathtaking landscapes, vibrant entertainment, and unimaginable traffic. The latter has led to car accidents becoming common on the state’s busy roads and highways. The consequences of these accidents can be devastating, resulting in property damage, serious injuries, and fatalities. Arash Law is here to help if you have suffered an injury or lost a loved one in a car accident.
The California Highway Patrol’s Statewide Integrated Traffic Records System (SWITRS) 2019 Report showed 269,031 injuries and 3,737 deaths related to car accidents that year. The estimates for 2022 put that number at 221,559 injuries and 4,030 deaths (See Number of Car Crashes Section below). These staggering figures indicate a clear and pressing need for measures to improve road safety in the Golden State.
Understanding the scope and magnitude of this problem is critical for assessing safety needs and preventing accidents. This can be gained by examining California auto accident statistics, which provide insights into road safety issues. In this article, you will find information about data access tools, collision statistics in California, their common causes, and how factors like alcohol and seatbelts affect these crashes.
Our experienced California car accident lawyers at Arash Law have handled personal injury cases for years. We know that the road safety issue in the state is becoming increasingly critical. In sharing our findings, we hope to raise awareness and advise car accident victims on how to pursue compensation for their medical bills, lost wages, and other losses.
Transportation Injury Mapping System (TIMS)
The Transportation Injury Mapping System (TIMS) is an interactive online mapping tool providing detailed information on transportation-related injuries and deaths in California. Funded by the California Office of Traffic Safety (OTS), the Safe Transportation Research and Education Center (SafeTREC) of the University of California, Berkeley, developed and maintained the tool. Transportation planners, researchers, and policymakers can use TIMS to identify high-risk locations and populations, analyze crash data, and design interventions for road safety.
The system integrates data from various sources, including the California Highway Patrol’s SWITRS, to provide a comprehensive view of transportation-related injuries and fatalities in the state. Users can generate maps and report on variables such as crash severity, location, time of day, and type of road user (e.g., motorist, pedestrian, cyclist, etc.). Some of the key tools available on TIMS include:
- SWITRS query & map
- SWITRS GIS map
- California safety PM target setting
- Collision diagram
- SRTS map viewer
- ATP maps & summary data
- Motorcycle collision map
California Office Of Traffic Safety (OTS)
The California Office of Traffic Safety (OTS) is a state government agency responsible for promoting and improving road safety in California. Established in 1966 and operated under the California State Transportation Agency, its mission is to reduce the number and severity of traffic collisions and injuries in the state by providing leadership, coordination, and funding for effective traffic safety initiatives.
The OTS also developed a Collision Ranking Tool, allowing users to explore California crash data. The tool can pull up information about high-risk locations for traffic accidents and compare statistics among cities with similar-sized populations. Below is a list of some of the other data and statistical resources provided by the OTS:
- California Traffic Safety Quick Stats (Fast Facts)
- California Fatality and Injury Statistics (SWITRS)
- National Traffic Research and Analysis (NCSA)
- California Department of Motor Vehicles Research (DMV)
- California Demographic, Economic, and Financial Research (DOF)
- National Transportation Statistics (RITA)
- Traffic Safety Resources
Number Of Car Crashes, Injuries, And Deaths In California For 2020-2022
Various organizations collect California auto accident statistics, including the California Office of Traffic Safety (OTS) and the California Highway Patrol (CHP). Most of the latest data available is from 2022, though data from 2021 to 2022 are provisional and subject to change.
Listed below are some of the findings on car accident statistics in California leading up to 2022, taken from the Statewide SWITRS Summary of the Transportation Injury Mapping System (updated as of June 2023).
2022
- There were 159,623 total traffic crashes involving injuries or fatalities.
- Of the total, 155,878 were injury crashes, while 3,745 were fatal crashes.
- From these crashes, 221,559 were injured, while 4,030 were killed, a total of 225,589.
- There were 11,787 pedestrians killed or injured, 1,777 were older adults, and 1,073 were children.
- About 8,811 bicyclists were killed or injured, and 1,102 were children.
- 12,427 deaths and injuries involved motorcyclists.
- Around 27,396 of all crash-related deaths and injuries were alcohol-involved, while 76,114 were speeding-related.
2021
- There were 162,092 total traffic crashes involving injuries or fatalities.
- Of the total, 157,941 were injury crashes, while 4,151 were fatal crashes.
- From these crashes, 225,198 were injured, while 4,465 were killed, a total of 229,663.
- There were 11,444 pedestrians killed or injured, 1,679 were older adults, and 923 were children.
- Approximately 7,770 bicyclists were killed or injured, and 820 were children.
- 11,911 deaths and injuries involved motorcyclists.
- About 28,548 of all crash-related deaths and injuries were alcohol-involved, while 79,721 were speeding-related.
2020
- There were 147,148 total traffic crashes involving injuries or fatalities.
- Of the total, 143,476 were injury crashes, while 3,672 were fatal crashes.
- From these crashes, 203,888 were injured, while 3,982 were killed, a total of 207,870.
- There were 11,154 pedestrians killed or injured, 1,690 were older adults, and 780 were children.
- Around 8,095 bicyclists were killed or injured, and 652 were children.
- 10,986 deaths and injuries involved motorcyclists.
- Approximately 23,275 of all crash-related deaths and injuries were alcohol-involved, while 67,957 were speeding-related.
Common Causes Of California Auto Accidents
As the statistics above reveal, collision fatalities and injuries occur daily in California. A variety of potential causes lead to an automobile accident, and it’s important for drivers to become familiar with the most common ones. Awareness of these factors can help promote better safety habits, spread awareness, and, ultimately, save lives.
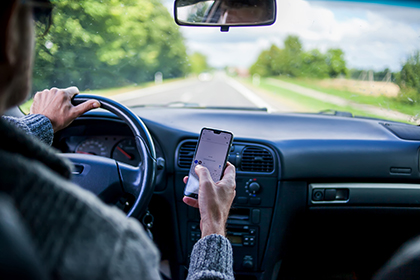
- Distracted Driving — With the rise of smartphones and other devices, crashes stemming from distracted driving are becoming increasingly common.
- Drunk Driving — From 2017 to 2022, alcohol-impaired driving accounted for 22 to 26% of California’s traffic fatalities.
- Speeding — From 2017 to 2022, speed was indicated as the primary crash factor in more or less one-third of California’s fatal and injury car accidents.
- Breaking Traffic Laws — Running red lights, failing to yield, and other forms of neglecting traffic laws put drivers and others on the road at serious risk.
- Drowsy Driving — Those who drive while tired or sleep-deprived are significantly more likely to cause a crash.
- Inexperienced Drivers — Teenagers or those who recently obtained their driver’s licenses are at a greater risk of car accidents.
- Aging Drivers — Drivers 65 and over accounted for 13.8% of statewide fatalities in 2018-2022, with improper turning being the most common factor in aging driver collisions.
- Dangerous Roadways — Potholes, uneven pavement, debris, and other poor road conditions can cause accidents. Other factors making roads more dangerous are a lack of proper signage, inadequate lighting, confusing road design, and poor road construction.
- Bad Weather — Rain, fog, or other adverse weather conditions can make it more difficult for drivers to arrive at their destinations safely. Wet roads, in particular, can lead to skidding or hydroplaning, potentially resulting in a crash.
Several other factors can increase the likelihood of getting into a car accident, such as driving at night. Intoxicated drivers and poor visibility make nighttime the most dangerous time to drive. In addition, vehicle defects are a common cause of crashes, as faulty brakes, defective tires, and other mechanical issues can lead drivers to lose control.
If you were in a car accident, one or a combination of the factors above likely contributed to the mishap. Contact Arash Law for a free case review. We’ll walk you through the process of seeking compensation for your injuries, property damage, and pain and suffering.
Locations Of Fatal Crashes
According to California’s statewide collision overview from the 2020-2024 Strategic Highway Safety Plan, the Los Angeles area accounts for a significant portion of all traffic-related injuries and deaths. Below is a rundown of traffic deaths from 2008 to 2017 in various regions throughout California.
- Los Angeles — 15,530 (49%)
- San Francisco Bay Area — 4,708 (15%)
- San Diego — 2,564 (8%)
- Redding — 1,429 (4%)
- Sacramento — 2,872 (9%)
- Fresno — 4,816 (15%)
The numbers above indicate a higher frequency of accidents occurring within or near urban areas. In 2019, 2,463 people died from crashes near cities, compared to 1,135 people in rural areas. In all regions, accidents occurring in intersections, interchanges, and other roadway access points accounted for roughly 40% of all collisions, making these areas some of the most dangerous on our roads.
How Many People Die In Car Accidents In California?
Making up around 12% of the total U.S. population, California also represents one of the country’s major locations for traffic accidents. Between 2018 and 2022, 20,018 people were killed and 1,194,530 were injured, with 83,759 being serious road collisions in the state. The statistics translate to an average of 4,000 traffic-related deaths per year.
However, it’s important to keep in mind that the greater population size in California is a contributing factor to these figures. Measured per capita, or miles traveled, California is not a particularly dangerous place to drive.
Most fatal car accidents kill only one person. For instance, in 2019, there were 3,438 fatal crashes. These crashes led to 3,737 deaths in California, which is an average of 1.1 deaths per fatal crash (the same can be said for 2022).
It’s worth noting that the number of deaths per fatal crash can vary depending on various factors, including the number of vehicles involved, the speed at which each vehicle was traveling, the types of vehicles, and the conditions on the road.
Seatbelt Use And Alcohol Use As Major Fatal Crash Factors
Apart from speeding, alcohol-impaired driving, and seat belt non-use are the major behavioral focus areas of the National Highway Traffic Safety Administration (NHTSA). They believed these three factors explained the increase in traffic fatalities seen from 2020 to 2021, although they weren’t the only ones. All data presented in this section is taken from the 2021 Overview of Motor Vehicle Traffic Crashes of NHTSA, unless otherwise stated.
Seatbelt Non-Use Fatalities
Seatbelts and other safety restraints save many lives yearly, but are not 100% effective. Nationwide, the passenger vehicle front-seat belt use for adults increased from 90.3% in 2020 to 90.4% in 2021, which is not statistically significant. Among those killed in 2021, half (11,813) were unrestrained (11,820 were restrained). 57% of those killed during the nighttime were unrestrained, compared to 43% during the daytime.
Of those occupants of passenger vehicles who survived fatal crashes in 2021, only 15% were unrestrained compared to 50% of those who died. During the nighttime, 17% of passenger vehicle occupants who survived fatal crashes were unrestrained, compared to 13% during the daytime.
In California, the aforesaid Statewide SWITRS Summary reported 789 unrestrained occupant fatalities out of the 4,030 total in 2022. The year 2021 saw the highest number of deaths, with 923 out of 4,465.
In 2018, 93% of adults reported always wearing seatbelts in California compared to the 87% national rate. There were 633 unrestrained occupant deaths that year out of 3,804. The following year, in 2019, the state was second, with 96%, just behind Hawaii, regarding seatbelt usage. Six hundred forty-eight died out of 3,737 deaths.
Alcohol-Impaired Driving Fatalities
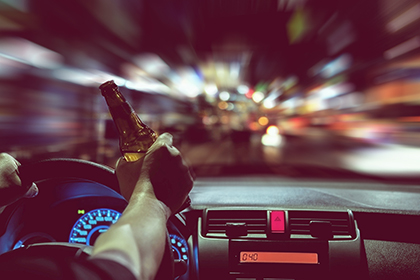
Driving under the influence also significantly contributes to traffic fatalities in the United States. Roughly 37 people nationwide die in drunk-driving crashes every day in 2021 — that’s one person every 39 minutes. Thirteen thousand three hundred eighty-four alcohol-involved traffic deaths were reported — a 14% increase from 2020 — accounting for 31% of overall traffic-related fatalities that year.
In California, the percentage was slightly higher than the national average, at 32%, with 1,370 alcohol-involved traffic fatalities out of 4,285 total deaths.
Additionally, the aforementioned California statewide collision overview stated that from 2008 to 2017, drunk driving collisions were more likely to occur on weekends (Friday, Saturday, and Sunday), with 78% happening between 4 p.m. and 3 a.m.
With so many people injured and killed due to drunk driving, it can be difficult to accept that this type of collision is preventable. If you intend to drink, always designate a sober driver or arrange for alternative transportation.
The Average Settlement Amount For A California Car Accident Claim
California car accident settlement amounts vary widely depending on the case’s specifics, including injuries, property damage, lost income, and pain and suffering. For serious injuries such as broken bones, spinal cord injuries, or traumatic head injuries, potential values of claims can be substantial.
Talk to our car accident lawyers to discuss the specifics of your case. We can provide you with an estimate of the compensation you may be able to pursue.
Contact Arash Law For A Free Initial Consultation!
If you suffered an injury or a loved one was killed in a car accident, the dedicated California injury attorneys at Arash Law, under the leadership of Arash Khorsandi, Esq., can help you pursue damages for your losses.
With decades of combined experience, our team can help you seek compensation for property damage, medical expenses, lost income, and pain and suffering.
Our legal team at Arash Law understands the stress and uncertainty that can follow a car accident. That is why we provide our valued clients with personalized attention and skilled legal representation.
Contact Arash Law for your free initial consultation by calling (888) 488-1391. We serve clients in California, including Los Angeles, San Diego, Sacramento, San Francisco, Riverside, San Jose, and Orange County.